
The construction of a temperature rise test model plays a crucial role in evaluating the performance of electronic products. A temperature rise curve not only helps engineers verify the reliability and rationality of product design, but also offers a more comprehensive assessment of the overall performance. So, how can you conduct an accurate temperature rise test to obtain reliable data?
**First, the Temperature Rise Test**
To evaluate the lifespan and stability of electronic devices, it's common to measure the temperature rise of key components such as IC chips and IGBTs. The device under test is placed at a specific ambient temperature—like room temperature—and then operated. The increase in temperature above the ambient level is recorded. This allows engineers to determine whether each component’s temperature rise falls within the acceptable range specified by industry standards, thus verifying the product's reliability and design efficiency.
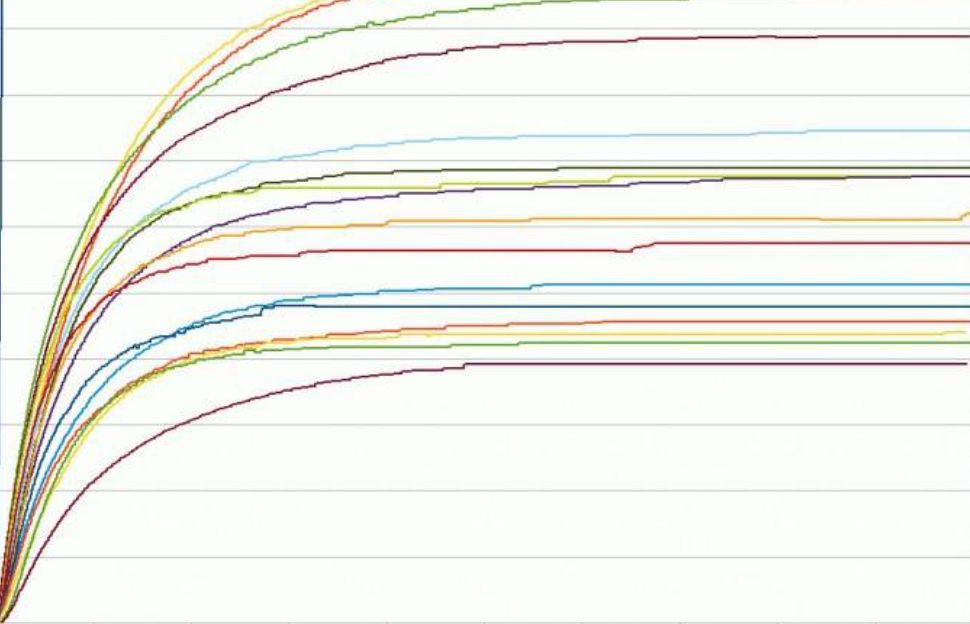
The main goal of the temperature rise test is to collect temperature changes at various points. Engineers observe if the temperature curve behaves as expected, such as whether the rise remains within the allowable limits. If any abnormalities are detected, the test is stopped immediately, data is saved, and further analysis is conducted. Figure 1 shows a typical temperature rise record.
**How Is Temperature Rise Recorded and Operated?**
**1. Traditional Testing Methods**
In the past, engineers would manually use data acquisition systems to collect temperature readings from the device under test, then process the data in Excel by subtracting the ambient temperature. However, this method is labor-intensive and prone to errors, leading to less accurate results.
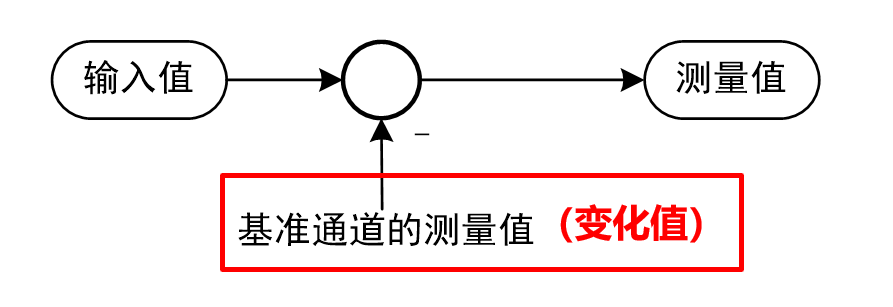
**2. New Digital Data Mining Method**
A more advanced approach involves using the Delta method to measure the difference between the input (device operating temperature) and the reference channel (ambient temperature, like room temperature). This delta value is used as the measured temperature, making it easier to track deviations from the baseline. As shown in Figure 2.
**Second, Building the Test Environment**
For example, during a power supply temperature rise test at 25°C, thermocouples (such as Type K, J, T, or E) are typically used to monitor critical components like IGBTs and inductors. These sensors are carefully placed on the surface of the components and connected properly for accurate readings.
Thermocouple installation includes:
- **Soldering the joint**: The probe is positioned close to the target area and securely attached.
- **Wiring**: Internal wires should be neatly arranged, secured with high-temperature tape, and routed through designated channels.
- **Outlet**: Avoid routing cables through unsafe areas like air inlets or outlets.
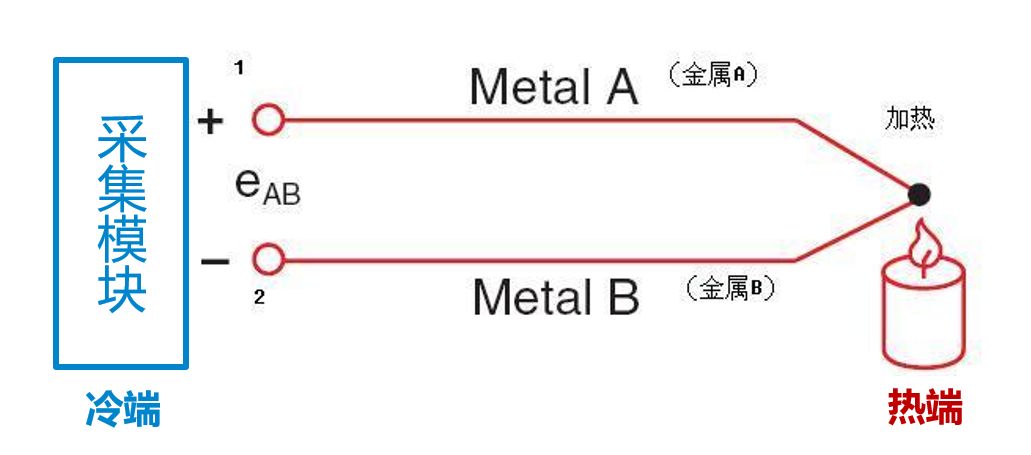
When two different conductors or semiconductors form a loop, and their junctions are at different temperatures, an electromotive force is generated. This phenomenon, known as the thermoelectric effect, is the basis for thermocouple operation. The temperature rise process is determined based on this principle.
**Third, Multi-Level Cascaded Distributed Acquisition**
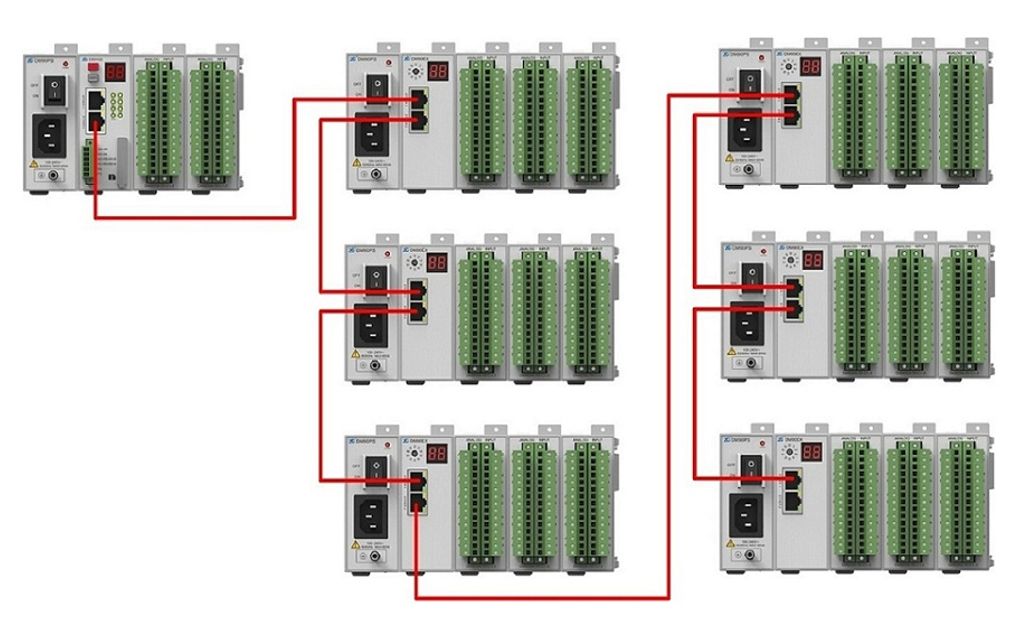
When testing multiple scattered locations, it's efficient to install separate measurement units alongside the data logger. This avoids long signal cable runs. With DM100 data acquisition recorders, up to 200 channels can be expanded, offering high scalability for multi-channel data collection. Figure 4 illustrates the cascading setup.
**Fourth, Data Summary and Processing**
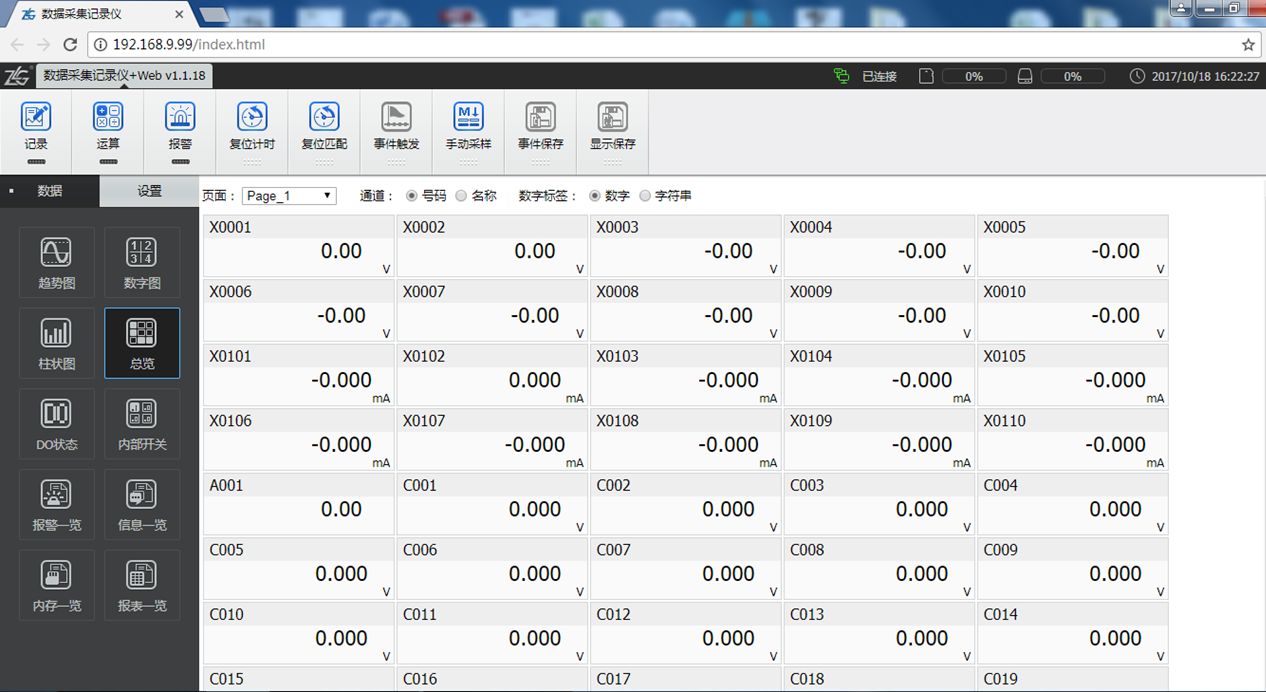
The analog signal acquisition modules use 32-bit ADCs with a DC voltage accuracy of up to 0.05%. They support simultaneous sampling across modules, with a maximum sampling rate of 100ms per 10 points. Channel isolation of 1000V AC ensures effective shielding against interference. Built-in digital filters help eliminate noise, allowing stable operation in industrial environments and ensuring accurate raw data collection. Figure 5 shows the web-exported data.
ZLG Zhiyuan Electronics’ DM100 and DP100 data acquisition recorders are versatile tools that provide users with modular designs to collect various signals, including DC voltage, current, digital inputs, and temperature/humidity. They support real-time monitoring and display of measurement results. Users can customize data processing and ensure reliable storage and recording. These devices offer a complete solution—from data acquisition to storage—making them ideal for industrial applications.
Cob Lights ,Cob Led Strip,Cob Led Light,Cob Strip Light
Guangzhou Cheng Wen Photoelectric Technology Co., Ltd. , https://www.cwledwall.com